Finance systems
What Is a Finance Semantic Layer—and Why Does AI Need One?
Raw tables contain financial data. They do not contain finance’s agreed meaning. A finance semantic layer makes that meaning explicit, testable and reusable.
Finance teams rarely disagree because one person cannot query the database. They disagree because the same apparently simple question can carry several valid definitions.
What counts as revenue? Which accounts sit above or below gross profit? Does a business-unit view follow the current organisation or the structure that was in place when the transaction occurred? Is “plan” the original budget, the latest forecast or a named scenario? Should utilisation be summed, averaged or recalculated from its numerator and denominator?
The answers do not live in raw transaction rows. They live in finance’s definitions, mappings, hierarchies and reporting conventions. A finance semantic layer is how those conventions become explicit enough for software—and now AI clients—to use them consistently.
The short definition
A finance semantic layer is a governed layer between financial source data and the tools that consume it. It gives business meaning to the data by defining the metrics, dimensions, hierarchies, scenarios and statement layouts finance has approved.
It answers questions such as:
- Which source accounts make up a reporting line?
- Which sign convention should the report use?
- How do cost centres roll into departments and business units?
- Which period and fiscal calendar does a comparison follow?
- Which version is actual, budget, forecast or scenario?
- How should a metric aggregate across months, entities or teams?
- What detail can this user retrieve behind the total?
The layer does not replace the ERP, planning platform or warehouse. Those systems continue to record transactions, hold plans and store analytical data. The semantic layer makes the financial meaning above them explicit and reusable.
Why raw tables are not enough
Take a question that appears straightforward:
What was Q1 gross margin against plan, by business unit?
A database may contain every row needed to answer it. It still does not answer the question on its own. Someone—or some governed logic—must know:
- Which accounts count as revenue and direct cost.
- How debit and credit signs should appear in the management view.
- Which plan version is being compared with actuals.
- How the fiscal quarter maps to source periods.
- How cost centres roll into the requested business units.
- Whether gross margin should be stored, summed or recalculated from its components.
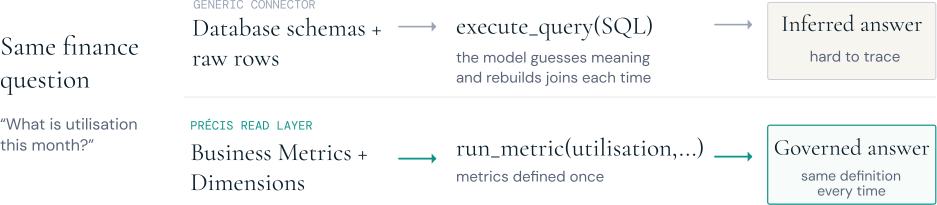
A generic database connector can expose the schema to an AI client. It cannot turn these choices into approved finance policy. If the client is left to infer them from column names and sample rows, two plausible queries can return two different answers.
That is not primarily a language-model problem. A human analyst given an unfamiliar schema would ask the same questions. The difference is that a human usually knows when to stop and ask finance. Software needs the answers encoded before the query begins.
What makes a finance semantic layer different?
Many BI and analytics platforms already use the term semantic layer. They define measures and dimensions so users do not have to rewrite SQL for every dashboard. That is useful infrastructure, and a finance semantic layer may extend it rather than replace it.
Finance adds several requirements that generic metric modelling does not always carry.
Financial-statement structure
A P&L or balance sheet is not simply a list of measures. Accounts map to lines; lines form sections; subtotals follow an ordered layout; signs and display rules matter. The same account may need different treatment in statutory and management views, provided each treatment is explicit.
Scenario and version meaning
Actual, original budget, latest forecast and working scenario are not interchangeable filters. Their names, versions and comparison rules need stable meaning across reports.
Hierarchies that reflect the business
Finance needs to move from group to entity, business unit, department, cost centre, account, project or another approved dimension. Those roll-ups may be ragged, derived or revised over time.
Non-additive metrics
Revenue can usually be summed. A rate, percentage or utilisation measure often cannot. The layer must know whether to sum, average, take a closing balance or recalculate from governed components at the requested grain.
Reconciliation and provenance
A useful finance answer is not complete at the total. The user must be able to see the definition used and trace the figure towards the source detail their permissions allow.
| Line / driver | Actual | Budget | Vs budget | Prior year | YoY |
|---|---|---|---|---|---|
| Revenue | 7,420 | 7,650 | −230 | 7,110 | +4.4% |
| Direct costs | (4,560) | (4,440) | −120 | (4,320) | −5.6% |
| Gross profit | 2,860 | 3,210 | −350 | 2,790 | +2.5% |
| Gross margin % | 38.5% | 42.0% | −3.5pp | 39.2% | −0.7pp |
| Operating costs | (1,240) | (1,280) | +40 | (1,180) | −5.1% |
| EBITDA | 1,620 | 1,930 | −310 | 1,610 | +0.6% |
| EBITDA margin % | 21.8% | 25.2% | −3.4pp | 22.6% | −0.8pp |
| Billable hours | 62,840 | 64,200 | −1,360 | 60,910 | +3.2% |
| Realised rate | €118.1 | €119.2 | −€1.1 | €116.7 | +1.2% |
| Utilisation % | 74.8% | 76.0% | −1.2pp | 73.5% | +1.3pp |
| Avg FTEs — billable | 142 | 140 | +2 | 137 | +3.6% |
| Avg FTEs — overhead | 40 | 40 | — | 39 | +2.6% |
| Avg FTEs — total | 182 | 180 | +2 | 176 | +3.4% |
What the layer should contain
There is no single mandatory technology. The contract matters more than the tooling. A credible finance semantic layer usually makes the following explicit:
| Contract | What it governs |
|---|---|
| Source-facing views | Stable, documented columns and dimensions above raw schemas |
| Metric definitions | Formula, grain, aggregation behaviour, units and permitted dimensions |
| Account mappings | How source accounts resolve into management-reporting lines |
| Hierarchies | How entities, business units, cost centres and other dimensions roll up |
| Statement layouts | Ordered lines, sections, subtotals and presentation rules |
| Periods and scenarios | Fiscal calendar, actual/plan/forecast meaning and named versions |
| Permissions | Which users may retrieve which governed views and detail |
| Provenance | How a result identifies its definition and route back to source |
Definitions should be versioned and reviewable. A change to gross margin is a finance-governance decision, not an invisible edit inside one workbook or one prompt.
Why AI needs the layer
A language model is good at interpreting a question and helping a user navigate an unfamiliar interface. It should not be asked to invent the financial meaning needed to calculate the answer.
With no governed layer, an AI client must move directly from a phrase such as “gross margin against plan” to raw schemas. It may generate valid SQL and still choose the wrong accounts, scenario, hierarchy or aggregation. A technically successful query can therefore be financially wrong.
With a finance semantic layer, the division of work changes:
- The user frames the question in ordinary finance language.
- The client selects a governed metric, statement or drill operation.
- Deterministic code queries the approved views and catalogue definitions.
- The result returns with its dimensions and source context.
- The model may help explain or format the result, but it does not generate the figure.
This is the important boundary: the language model handles language; the finance layer handles financial meaning and calculation. When the required data or definition is absent, the correct response is to say so.
A practical way to start
The layer does not need to model the whole finance function before it creates value. Start with one recurring question whose answer is already important and contested—often a management P&L, actual-versus-plan variance or one operational metric.
- Choose the output. Name the statement, metric or comparison the team needs to reproduce.
- Identify the sources. Record where actuals, plans, hierarchies and operating drivers live today.
- Create stable views. Put a documented interface above the source schemas so downstream definitions do not depend on raw-table accidents.
- Write down the finance rules. Metric formulae, account mappings, hierarchy roll-ups, scenario names and display conventions become reviewed configuration.
- Reconcile before exposing. Test the governed result against the report finance already signs off.
- Expose read operations first. Let reports, spreadsheets, BI tools or AI clients retrieve governed answers before considering any write path.
This sequence turns semantic modelling into a finance-control exercise rather than a technology taxonomy project.
How Précis implements the pattern
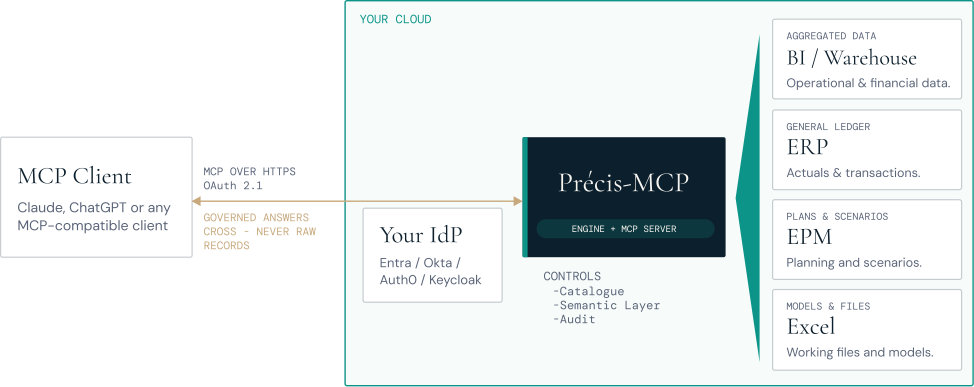
Précis Finance MCP, the source-available read engine at the core of Précis, implements this pattern with two layers the customer can inspect:
- Semantic SQL views in the customer’s ClickHouse analytical store provide the stable, source-facing data model.
- A YAML finance catalogue defines metrics, dimensions, hierarchies and financial-statement layouts over those views.
Read tools reference the semantic views rather than arbitrary raw tables. The same governed definitions can serve an MCP-capable client, the Précis Excel add-in and other tools that query the views. Calls are read-only, and results retain the dimensions needed to trace a figure towards source.
The full Précis platform adds the finance workflow above that layer: routine preparation, ad-hoc work, scenarios and reports that finance reviews and signs off. The semantic model is the foundation, not the finished management process.
- Governed metricGross margin recalculated from approved revenue and direct-cost definitions.catalogue/pnl.yml · metric gross_margin_pct38.5%
- Semantic viewQ1 actuals resolved at business-unit and account grain.ClickHouse · semantic.v_pnlQ1 2026
- Source dimensionsThe result retains the period, scenario, account and cost-centre context available to the caller.Actuals · 2026-01 to 2026-03 · governed scope
| Period | Scenario | Account | Cost centre | Amount |
|---|---|---|---|---|
| 2026-Q1 | Actuals | 4000 Revenue | CC-100 | 1,816,420 EUR |
The test that matters
A finance semantic layer is useful when two different tools can ask the same financial question and arrive at the same governed figure—and when finance can explain why.
The goal is not to hide complexity behind a friendly label. It is to put the complexity in one explicit, testable place: below the report, below the spreadsheet and below the AI conversation.
Next: See how Précis prepares recurring management reporting.
Technical path: Explore Précis Finance MCP.