Finance in practice
Financial Analysis in Databricks Genie and Précis: An FP&A Case Study
Five FP&A questions, from a monthly P&L to the drivers of performance. Compare the wait and the reporting work, using financial data already maintained in Databricks.
Revenue is below budget. You want to know which teams explain the gap, whether hours or rates deserve attention, and what to discuss with the department head.
For an FP&A team evaluating financial analysis in Databricks Genie, those are practical questions to test. Précis offers another way to work with that same data: it supports Databricks as an analytical backend for financial reporting, using the financial inputs your organisation already maintains there.
Working with an agent should help you follow those questions. The figures need to arrive promptly, the comparisons need to retain their meaning, and the report needs to be familiar enough to check as you go.
Précis lets finance teams use AI agents for FP&A reporting and planning on Databricks. The agent retrieves defined metrics and statements, investigates variances and prepares proposed plan changes. Précis applies the agreed financial rules; the finance professional directs the work, reviews the interpretation and approves changes to the plan.
We followed that investigation in Précis and Databricks Genie, using five identical financial requests on the same underlying data. Across those requests, Précis completed its responses in 16–35 seconds, compared with 73–108 seconds for Genie. The outputs also exposed a practical difference: how much reporting logic and interpretation the analyst needed to supervise.
This is a worked session using realistic sample company data. The examples below show what each system returned and what that meant for the next business question.
FP&A in Databricks Genie and Précis: the test
The example uses NovaTech’s Cloud & Infrastructure department, reviewing January–October 2026 against budget and prior year. Its management P&L combines 19 financial and operational lines, including margins, hours, utilisation and average and closing workforce measures.
Both systems queried the same underlying data on the same Databricks SQL warehouse. Genie had configured metric views, scenario definitions and a prepared P&L function. Précis used its financial catalogue and shared reporting engine, with Databricks as the analytical backend.
The five requests covered the monthly P&L, the revenue shortfall by cost centre, hours and rates, an all-department view, and September versus October. The findings then formed the basis of a department-head report.
Use your existing Databricks data with Précis
If your financial data already lives in Databricks, you can use Précis’s Databricks backend to run the reporting described here. Your existing data pipelines can continue maintaining the financial inputs in your Databricks warehouse.
Setup includes mapping those inputs to the required reporting views and agreeing the metric, statement and comparison definitions. Once configured, the analyst can request a P&L or budget comparison through Précis against that maintained data. This is the backend used in our case study.
The same reporting engine also underpins Précis Finance MCP, which exposes financial metrics and statements to compatible clients. This article compares the full Précis workspace experience, including its agent and reports, with the Genie interface.
Monthly P&L reporting on Databricks
A familiar statement makes the next question easier to ask. Précis applies configured line ordering, number formats and comparison layouts through its reporting engine. As you change the period or drill into a department, you can use the same conventions to read and check the figures.
In the Genie workflow we tested, the agent assembled the presentation as part of its answer. It could choose tables and charts suited to the question, but the suitability of those choices became another part of the output to review.
The request
Show the full Cloud & Infrastructure P&L by month, January–October 2026, actuals only.
Both systems retrieved the 19 statement lines for all ten months. Précis also returned a YTD total, applying the statement’s financial and operational definitions across the period.
For example, Genie’s captured monthly result was a paginated list of months, line items and values, with the visible lines in alphabetical order. Comparing months meant navigating that list. Précis returned the configured statement order and measure-specific formats through its standard reporting tools.
Both retrieved the underlying figures; the presentation changed how easily the analyst could work through them. The example illustrates the value of reusing a financial layout as the conversation develops.
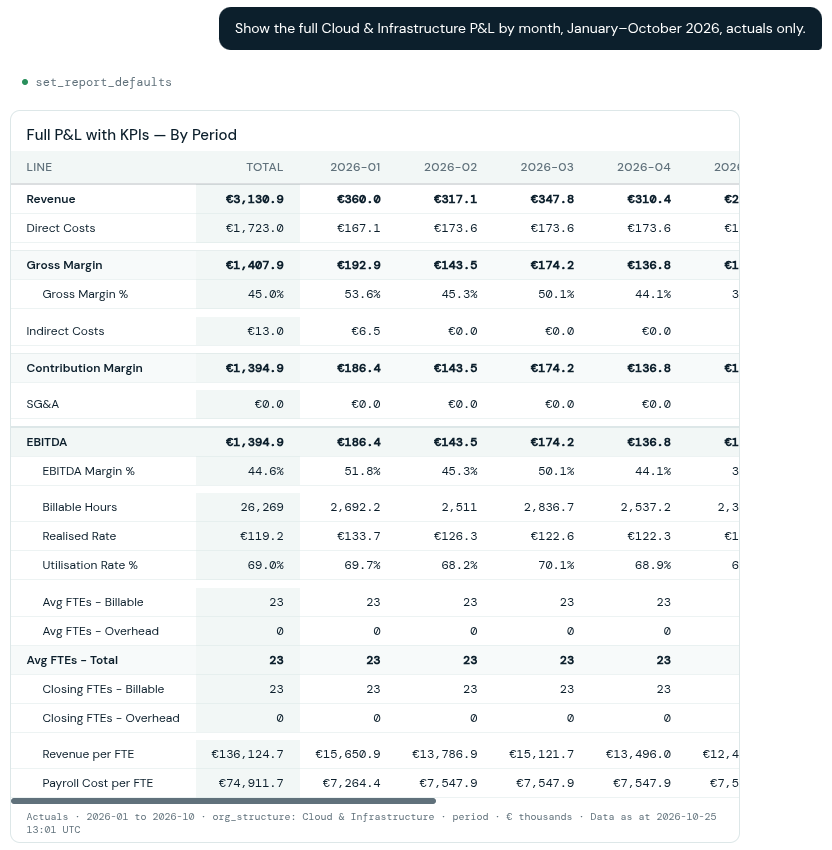
Précis: the same monthly P&L request, with financial statement ordering, operational KPIs, monthly columns and a YTD total. Open the capture to inspect the full-size detail.
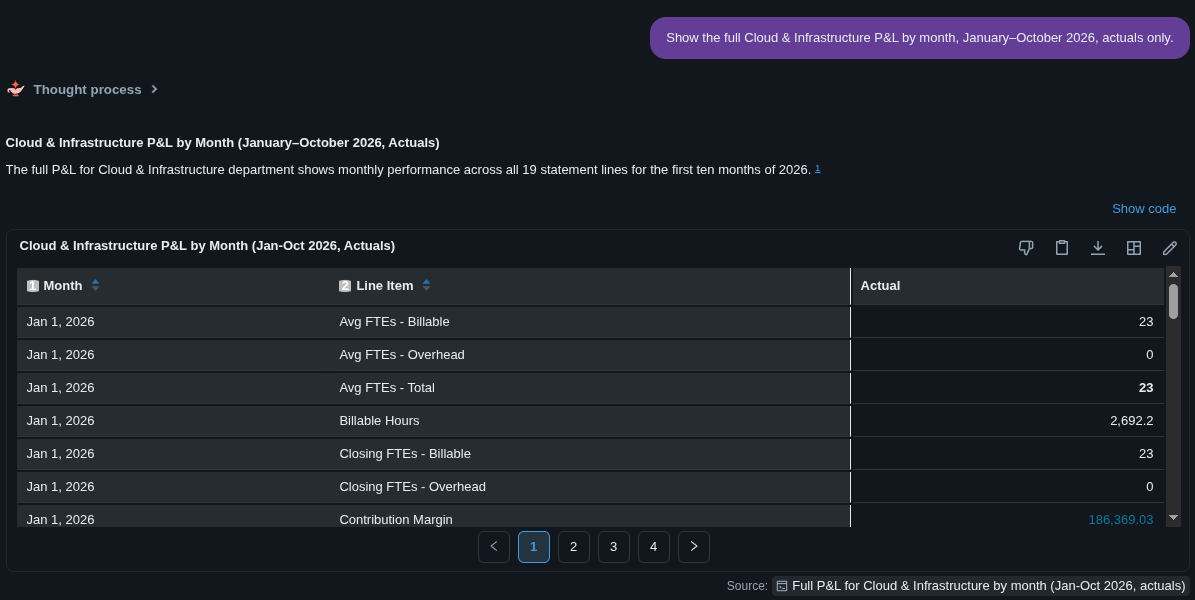
Genie: the monthly P&L displayed as a paginated list of months, line items and values. Open the capture to inspect the full-size detail.
Budget vs actual variance analysis by cost centre
A drill-down should stay connected to the statement you started from. Précis reuses the selected period, scope and comparisons when the analyst asks for a breakdown. The agent requests revenue by cost centre; the reporting engine handles the calculations and table structure. The analyst can follow the gap without having to reconstruct the comparison.
The request
Which cost centres explain the October YTD revenue shortfall against budget? Include prior year and the department total.
Précis returned a cost-centre breakdown with the period, department filter, comparative columns and total retained. Amounts are in € thousands, rounded for display.
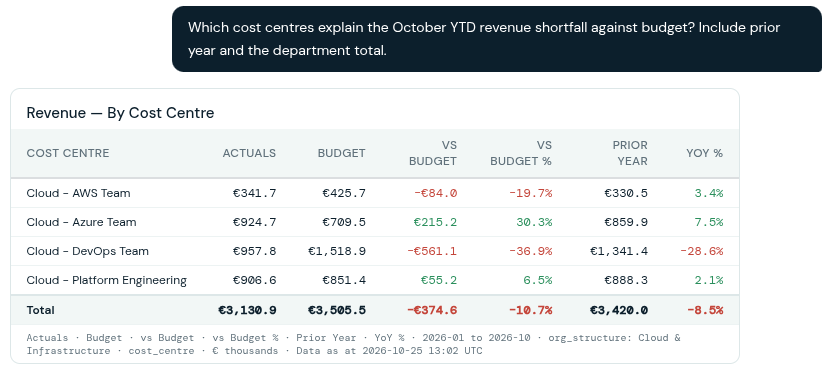
Précis: revenue by cost centre, with budget and prior-year comparisons, variance colours and the department total. Open the capture to inspect the full-size detail.
Its commentary opened:
DevOps is the main driver of the October YTD revenue shortfall.
It then identified the AWS shortfall and the Azure and Platform offsets, connecting them to the department’s €375k gap. The analyst could inspect the breakdown and choose where to investigate.
A routine drill-down required repeated attempts in Genie. The first requests for the cost-centre figures and department total returned nothing. The agent had to change how it requested the figures, then make further requests to prepare the chart and complete comparative table.
For the analyst, breaking down an existing revenue figure became a 107.9-second wait, compared with 21.0 seconds in Précis. Précis’s agent requested the defined revenue breakdown, with the reporting system supplying the comparisons and total.
The empty responses made these failed attempts detectable. A plausible but incorrect figure creates a harder problem: it can enter the explanation and the report without prompting another attempt. The company utilisation example below shows that happening in the same investigation.
A company total needs to preserve the metric’s meaning
An agent should be able to retrieve an agreed financial measure without recreating its calculation. In the company-wide comparison, the agents in Précis and Databricks Genie returned matching revenue, EBITDA margin, average billable FTE and closing billable FTE figures. Utilisation told a different story.
| Company utilisation | Précis | Genie |
|---|---|---|
| Actual | 61.0% | 38.5% |
| Budget | 65.9% | 41.7% |
Both models defined utilisation as total billable hours divided by total hours. Précis retained that definition for the company total.
Genie’s generated query instead averaged the department percentages, including overhead departments with zero utilisation. Its explanation then described that ordinary department average as a weighted average.
The result was plausible enough to pass into the explanation without a warning. This example shows the risk of asking an agent to write calculations for an already-defined financial measure. Précis lets the agent retrieve that measure through tools that apply its governed definition, reducing the scope for financial meaning to change between the question and the answer.
Read more about financial and operational KPI calculations in management reporting.
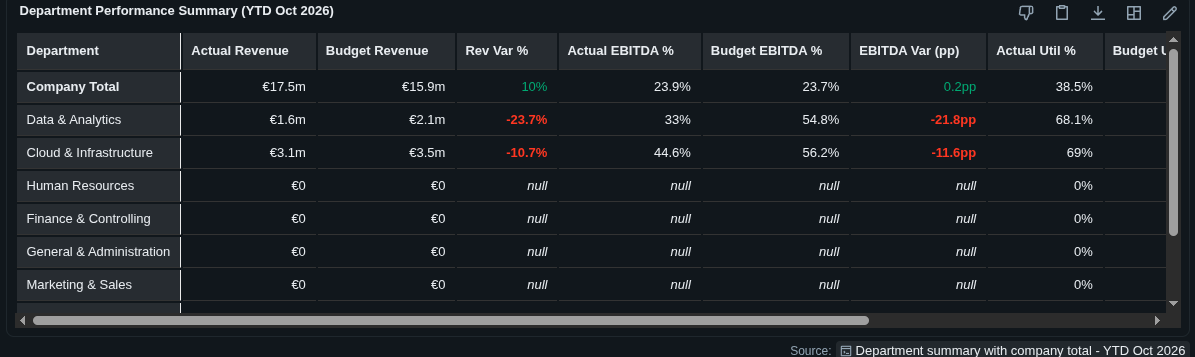
Genie’s company total shows 38.5% utilisation. The governed company measure returned 61.0% in Précis.
Compare months before deciding what needs action
Useful commentary helps the analyst distinguish an observation from an explanation that still needs testing. Précis pairs its reporting tables with brief interpretation and questions for further investigation. The figures remain available for the user to check and challenge the explanation.
The request
Back to Cloud & Infrastructure: compare September and October actuals. Show revenue, direct costs, EBITDA and utilisation.
Précis restored the department scope and changed the reporting period. It reported a €99k revenue decline, flat direct costs and a corresponding €99k EBITDA decline. Its reply also distinguished the larger revenue movement from the smaller change in utilisation:
Utilisation declined 1.9 percentage points, from 69.0% to 67.1%—a much smaller movement than revenue, suggesting realised rate, revenue mix or timing merits investigation alongside utilisation.
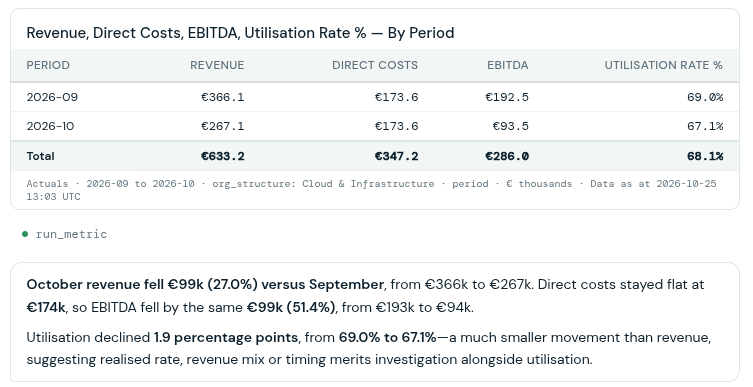
Précis: September and October actuals, with concise commentary linked to the figures. Open the capture to inspect the full-size detail.
Genie returned a comparison table and chart, then described October’s €267.1k revenue as the lowest month of the year, “significantly below” August’s €193.8k. Those figures contradict the conclusion.
That matters when preparing a business discussion. A fall from September deserves investigation; incorrectly presenting October as the year’s worst month changes the urgency and context of the message.
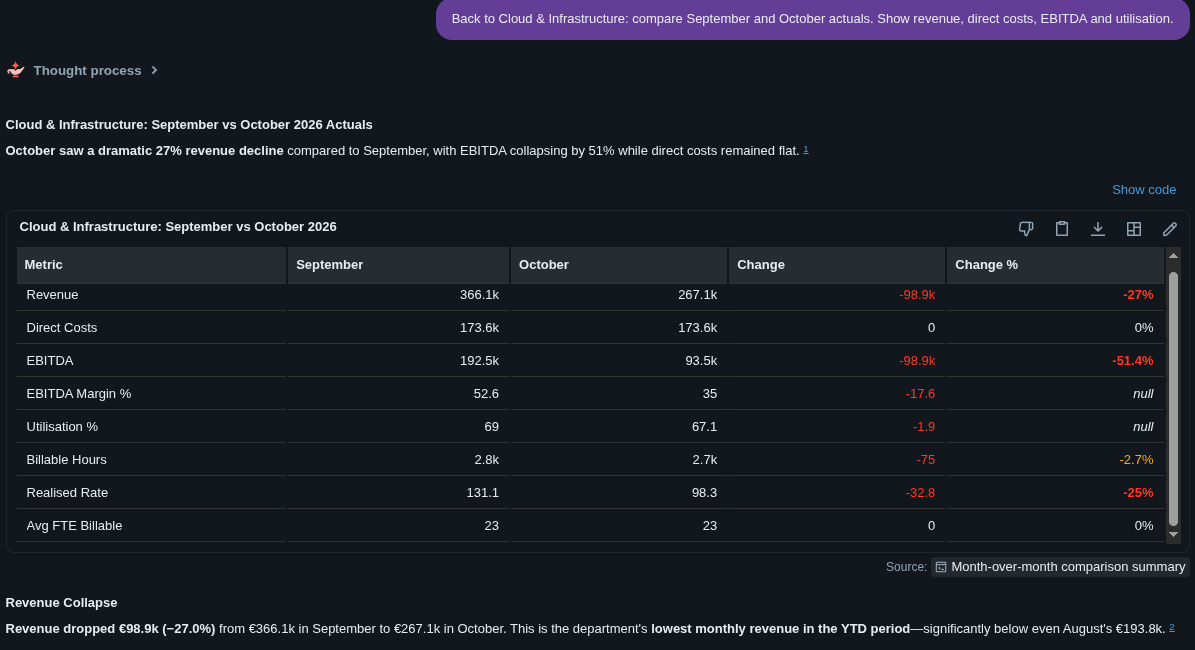
Genie: the September–October comparison and the contradictory claim about October’s position in the year.
Financial analysis: response times and agent costs
Waiting time affects the continuity of an investigation. Each answer should help the analyst decide what to ask next. Repeated pauses between related questions add friction to that working conversation.
The five data requests produced these completed response times:
| Task | Précis | Databricks Genie |
|---|---|---|
| Full monthly P&L | 35.3 s | 85.2 s |
| Revenue shortfall by cost centre | 21.0 s | 107.9 s |
| Hours, rate and utilisation | 16.2 s | 73.2 s |
| All-department comparison | 20.1 s | 88.6 s |
| September versus October | 19.5 s | 82.2 s |
For each question, Précis’s agent retrieved the figures with a single successful metric or statement call. Genie wrote 15 queries, including two failed attempts that it identified and corrected. The company utilisation error still reached the user as a plausible financial result.
For these routine finance questions, Précis let the agent use governed definitions directly, avoiding the repeated work of writing and repairing queries. The analyst and agent could focus on what the figures meant and what to investigate next.
Where the agent’s work goes
Token counts give a proxy for how much text an agent reads and writes. We estimated the new content exchanged during those same five questions:
| Agent activity | Token type | Précis | Databricks Genie |
|---|---|---|---|
| Requests and queries written by the agent | Output | 476 | 9,473 |
| Commentary written by the agent | Output | 728 | 2,526 |
| Results returned to the agent | Input | 17,141 | 8,840 |
Requesting the figures. A Précis request is similar to using an established Excel function: select the measure, business unit and periods, and the system applies the agreed calculation. In this session, Genie wrote queries around the financial definitions. Writing, checking and correcting those requests added work before the analyst received an answer.
Presenting the answer. Précis renders its financial tables directly from the retrieved figures, with ordered lines, subtotals, consistent units and favourable or unfavourable variance colouring. Genie chose generic data tables and charts to display its results and wrote more verbose replies. The second row reflects that commentary.
Précis supplies formatted financial statements and comparative tables throughout the investigation; Genie’s agent selects how to present each result. The analyst can work with a familiar financial format in Précis, while the agent concentrates on the question being asked. Together, the first two rows show approximately ten times as much visible generated content in Genie.
Giving the agent financial context. Précis’s results use more input tokens because they carry structured financial information alongside the figures: measure labels, display formats, scaling and whether a variance is favourable or unfavourable. These attributes make the intended interpretation explicit for the agent and support consistent presentation. That richer format explains the larger input payload in this comparison.
What this means for cost. In a simple illustration using identical prices for both systems, with output tokens priced at four times input tokens, Genie’s estimated cost for these exchanges is 2.6× Précis’s. The model includes both the larger Précis result payloads and the additional content generated by Genie. It covers newly exchanged content; the methodology below defines the estimate’s scope.
From variance analysis to a finance report
The investigation should leave the analyst with material for a business discussion. Précis brings the selected figures, comparative tables and draft commentary into a report that the finance professional can review and edit. The same financial presentation carries through from the working conversation to the report.
After the five financial requests, the analyst asked for a short department-head report with three findings, supporting tables and questions to investigate before action.
Précis assembled those elements into a report. It carried forward the revenue shortfall, team-level operating differences and September/October comparison. The investigation questions asked colleagues to check project revenue, contracts, write-offs, cost detail and posting completeness. Business causes remained unconfirmed.
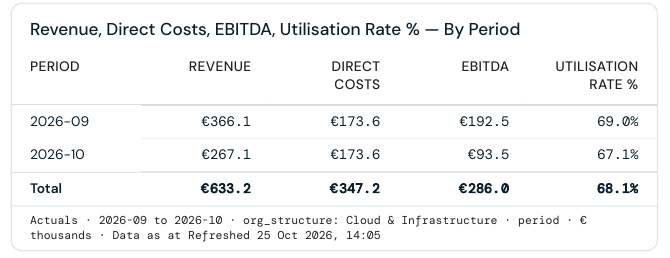
Extract from the generated Précis report PDF: the September–October comparison, with units, period and department retained.
Agentic FP&A on Databricks: what this case study shows
For an FP&A team considering agentic finance transformation, this case study examines a specific starting point: financial reporting and variance analysis on data already maintained in Databricks. It shows how the analyst and agent work through a review, with the finance professional directing the investigation.
The case illustrates the value of giving the agent established financial operations to request. Statements, comparisons and aggregation rules can be implemented once and reused as the analyst changes the question. Consistent presentation makes those results easier to inspect alongside the commentary.
In this session, Précis supported the investigation with shorter waits and five successful reporting calls, without any errors. Genie required 15 queries, including failed attempts, and incorrect figures and commentary reached its final responses. The Précis analyst could move from the P&L to the teams and operating measures behind the shortfall, then prepare questions for the business.
Précis prepares the figures and reporting structure. The finance professional directs the investigation, challenges explanations and decides what comes next.
This case study shows how agent-written financial queries can create trust, reliability and cost challenges that Précis addresses through direct access to governed measures and consistently formatted reports, reducing repeated query generation and the scope for calculation errors.
For the broader reporting and planning capabilities, read the Précis on Databricks product update.
Explore management reporting with Précis, or discuss financial reporting on your Databricks data.
About this case study
We ran this comparison on 25 October 2026, using realistic sample data for NovaTech. Both systems used the same financial inputs on a Databricks warehouse. Genie was configured with financial metrics, scenarios and P&L reporting before the exercise.
Response times come from the recorded conversations and system logs.
The token comparison estimates the text written and received by the agents during the five financial requests, using the same counting method for both. The cost illustration applies the same assumed prices to those exchanges. It covers the new requests, commentary and returned results shown in the table; background instructions, earlier conversation history and internal chart-generation work are outside that estimate.
The findings describe the workflows and outputs observed in this financial review.